What we do
Find Your Best Solution
We pair statistical and computer-science depth with your domain knowledge to build tools that fit how your team already works. The result is analytics your people actually use — streamlining operations and surfacing the growth hidden in your data.
By the numbers
Technical Experience
These aren't marketing figures. Each number below is a system we operate for a customer today — pipelines in production, events flowing, models answering questions from real data.

How data flows
Real-time Data
Your data lives in more places than you'd like — databases, vendor feeds, event streams, spreadsheets. We collect it all, normalize it into a single schema, and stream it where it's needed so every dashboard and model reads from the same source.
-
01
Ingest
Connect customer databases and third-party vendors without touching their schemas.
-
02
Normalize
Map every source to one schema so joins just work, even across messy vendor fields.
-
03
Stream
Serve dashboards and models in real time from a single, reliable source of truth.
From source to dashboard
The team
Who We Are
A small, senior team that has shipped data systems at scale. We staff every engagement with the four roles below — no hand-offs to a separate support tier, no junior resourcing learning on your data.
Build and tune the predictive models behind your dashboards — customized to your datasets, not a generic baseline.
Design, train, and deploy the models. They own the path from notebook to production so a prototype actually reaches your stack.
Keep the pipelines and servers running. They're who pages go to at 3am so your data stays live and your uptime stays guaranteed.
Your single point of contact. They translate between your goals and the engineering work, so expectations stay aligned end to end.
Dashboards
Custom Dashboards
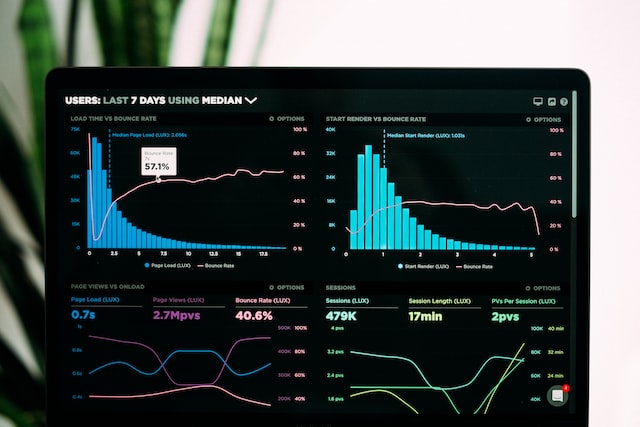
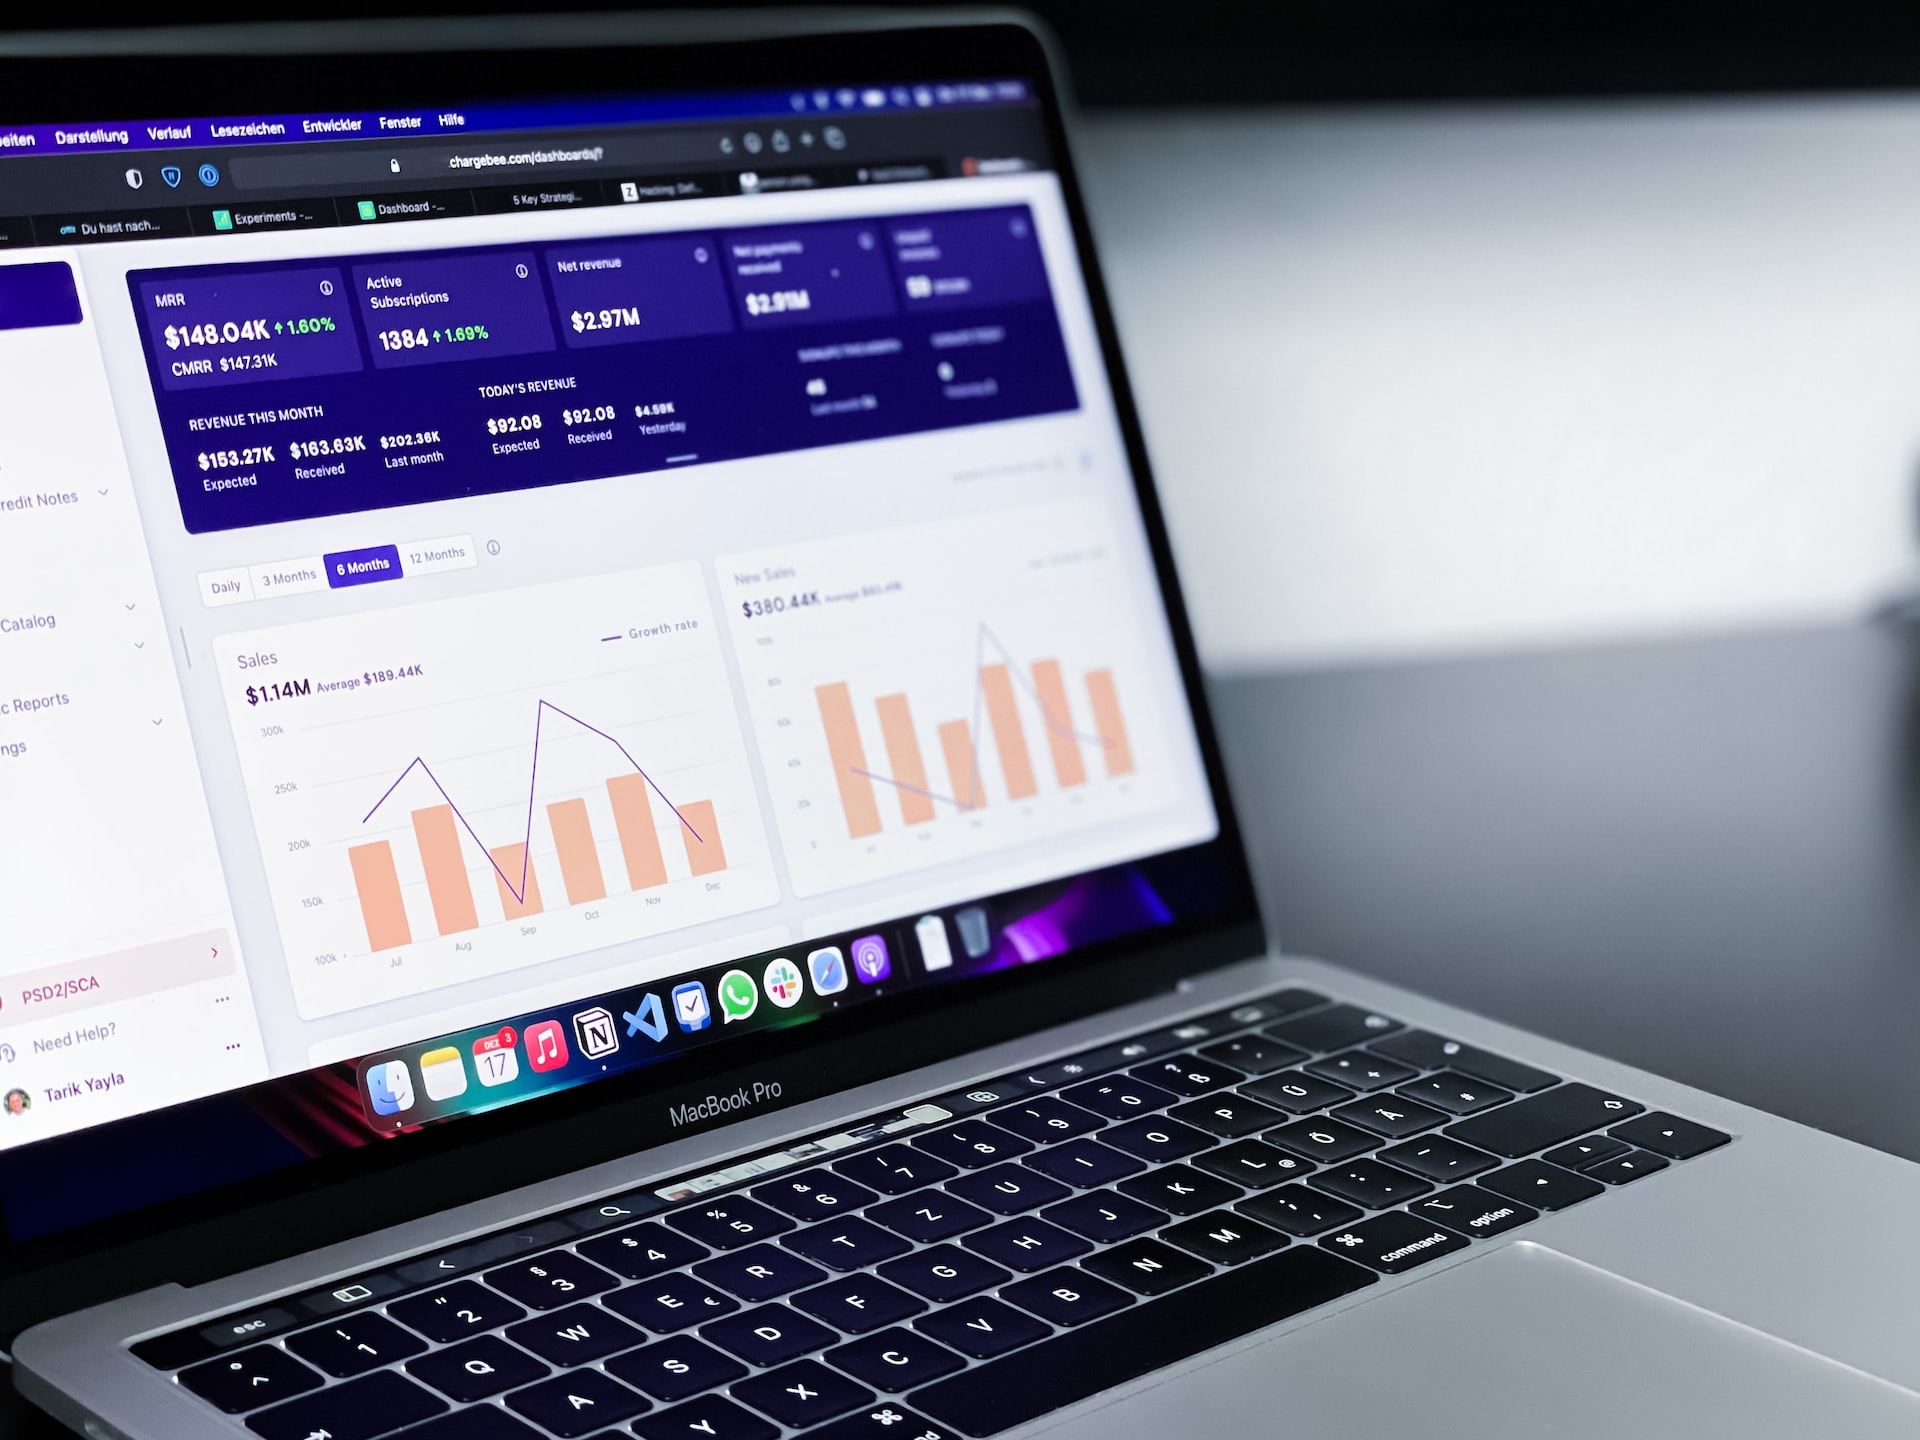
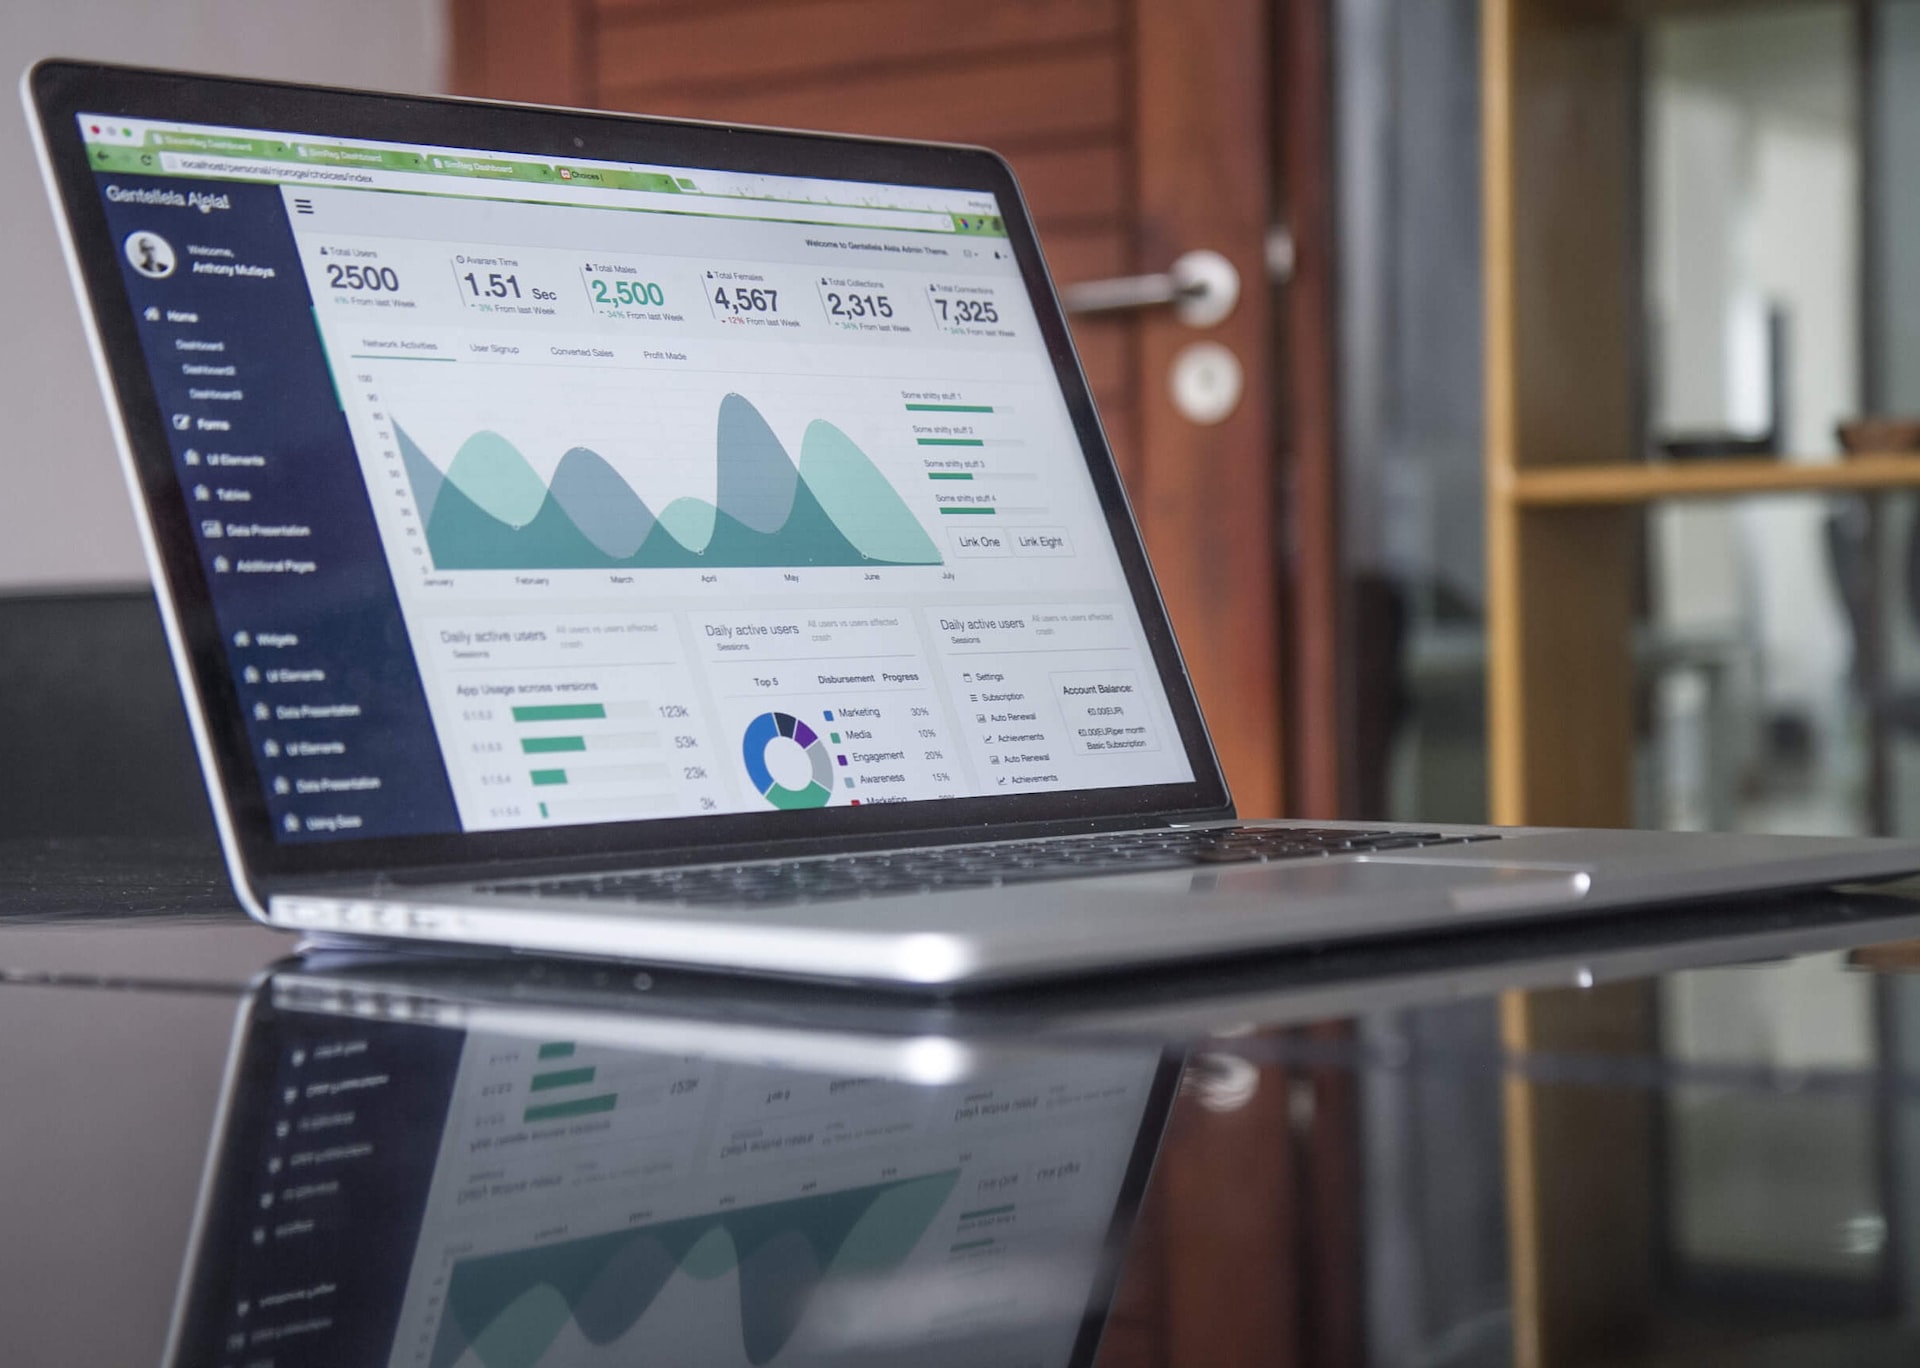
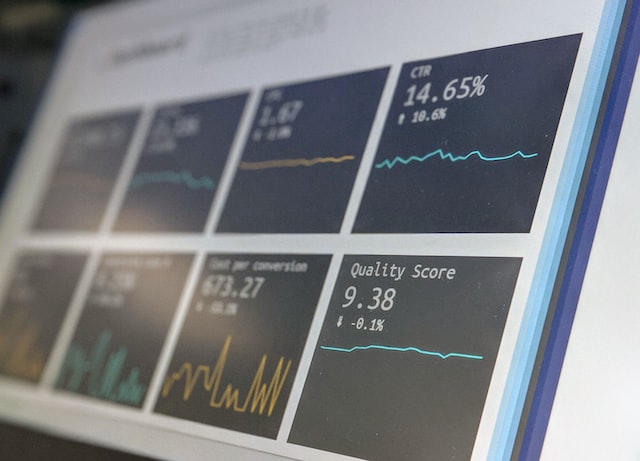
We build dashboards on top of your data sources and our machine learning pipelines, so your team can read the numbers that drive decisions without a spreadsheet open. Start from a pre-made template, or have us design one around the metrics you actually track.
-
Real-time updates — queries refresh as new data lands, not on a nightly cron.
-
Your data sources — connects to the databases and feeds you already run.
-
Model outputs — forecasts and scores from our pipelines, alongside raw numbers.
-
Role-based views — each team sees the metrics that matter to their job.
-
Templates or custom — start from a pre-made layout, or have us design one for you.